- تحليلات
- التحليل الفني للسوق
Advanced Micro Devices Inc. التحليل الفني - Advanced Micro Devices Inc. التداول: 2024-09-24
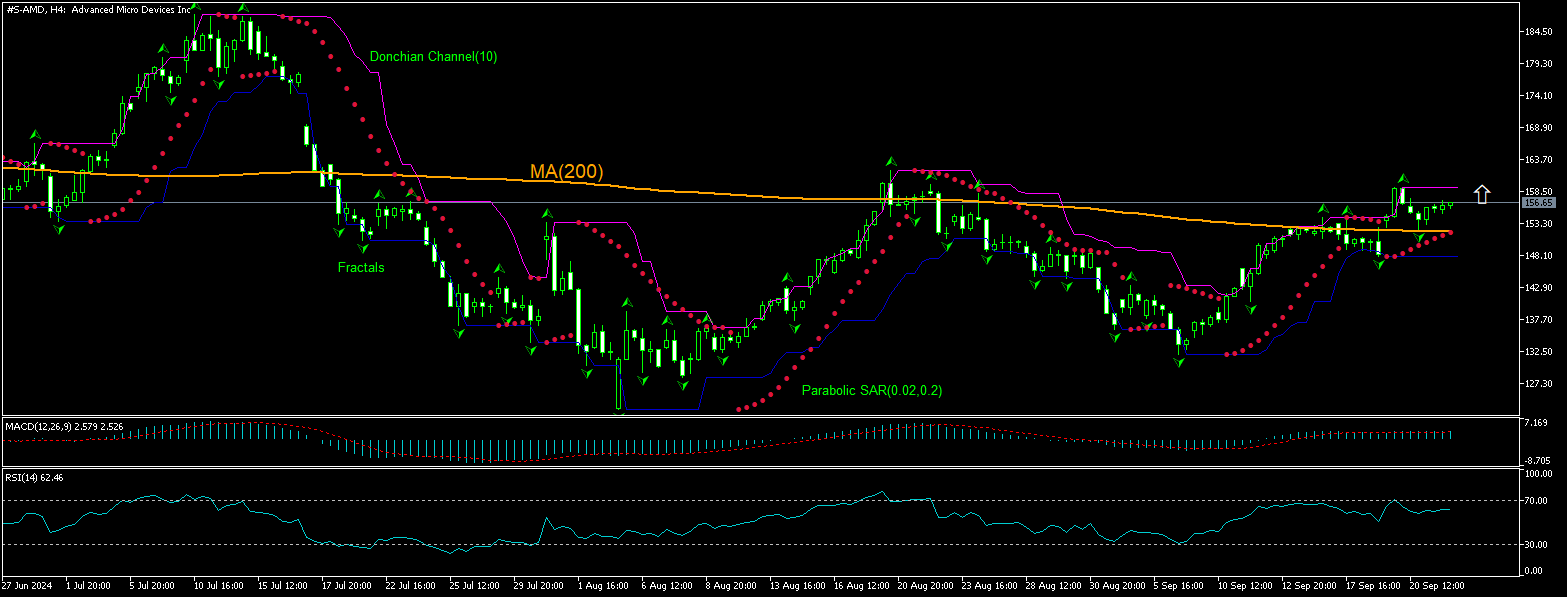
Advanced Micro Devices Inc. ملخص التحليل الفني
أعلى من 159.15
Buy Stop
أقل من 151.00
Stop Loss
| مؤشر | الإشارة |
| RSI | محايد |
| MACD | محايد |
| Donchian Channel | محايد |
| MA(200) | شراء |
| Fractals | شراء |
| Parabolic SAR | شراء |
Advanced Micro Devices Inc. تحليل الرسم البياني
Advanced Micro Devices Inc. التحليل الفني
The technical analysis of the AMD stock price chart on 4-hour timeframe shows #S-AMD, H4 is rising as the price breached above the 200-period moving average MA(200) following a rebound after hitting six-week low eighteen days ago. We believe the bullish momentum will continue after the price breaches above the upper boundary of Donchian channel at 159.15. This level can be used as an entry point for placing a pending order to buy. The stop loss can be placed below 151.00. After placing the order, the stop loss is to be moved every day to the next fractal low, following Parabolic indicator signals. Thus, we are changing the expected profit/loss ratio to the breakeven point. If the price meets the stop loss level (151.00) without reaching the order (159.15), we recommend cancelling the order: the market has undergone internal changes which were not taken into account.
التحليل الأساسي لـ الأسهم - Advanced Micro Devices Inc.
AMD stock edged up yesterday after AMD chief predicted a shift from GPUs toward a broader range of chip architectures. Will the AMD stock price resume advancing?
Advanced Micro Devices, Inc. is an American corporation engaged in designing and manufacturing of processors and graphics processing units (GPUs). Nvidia currently dominates the market for GPUs used for running computationally intensive AI workloads. But AMD's Instinct MI300 series accelerators provide a viable alternative to Nvidia's current H100 GPU, analysts say. AMD chief Lisa Su noted that while GPUs remain the top choice for large language models due to their efficiency in parallel processing, the future will likely see a shift toward a broader range of chip architectures. Recent reports indicated AMD is focusing on the mainstream and mid-range GPUs, abandoning the premium gaming GPU market led by Nvidia that helped Nvidia reach a trillion-dollar valuation. To help with setting a perspective, it should be noted that large cloud providers like Amazon and Google have developed their custom AI chips for internal use. It looks like AMD is abandoning efforts to catch up Nvidia in premium gaming GPU market which was instrumental in Nvidia’s dash to a leading name in the development of AI chips. It is not clear if the shift in AMD strategy to the mainstream and mid-range GPUs and planning to capitalize on a shift in large machine learning models toward a broader range of chip architectures will be really successful. Meantime AMD’s market capitalization rose to $253.7 billion from $161.8 billion in May 2022. At the same time its valuation has stretched: Forward P/E ratio has risen to 29.41 from of 21.10 in May 2022. And according to AMD's latest financial reports and stock price the company's current price-to-earnings ratio (Trailing Twelve Months) is 1306.25. At the end of 2022 the company had a P/E (TTM) ratio of 72.8. High valuation is a downside risk for a company stock. However, the current setup is bullish for AMD stock price.
استكشف
شروط التداول لدينا
- فروق الأسعار من 0.0 نقطة
- أكثر من 30,000 أداة تداول
- مستوى التوقف (الستوب أوت) - 10% فقط
هل أنت مستعد للتداول؟
فتح حساب :تنبيه
يحمل هذا الموجز طابعاً إعلامياً و تعليمياً و تنشر بالمجان . تأتي معظم البيانات المدرجة في الموجز من المصادر العامة معترفة أكثر و أقل موثوقية . مع ذلك ، لا يوجد تأكيد على أن المعلومات المشارة إليها كاملة و دقيقة . لا يتم تحديث الموجز . معظم المعلومات في كل موجز ، تتضمن الرأي و المؤشرات و الرسوم البيانية و أي شيئ اخر وتقدم فقط لأغراض التعريف وليس المشورة المالية أو توصية . لا يمكن اعتبار النص باكماله أو أي جزء منه و أيضاً الرسوم البيانية كعرض لقيام بصفقة بأي اداة . آي إف سي ماركيتس وموظفيها ليست مسؤولة تحت أي ظرف من الظروف عن أي إجراء يتم اتخاذه من قبل شخص آخر أثناء أو بعد قراءة نظرة عامة .

