- تحليلات
- التحليل الفني للسوق
الذهب التحليل الفني - الذهب التداول: 2021-01-11
الذهب ملخص التحليل الفني
أقل من 1820
Sell Stop
أعلى من 1960
Stop Loss
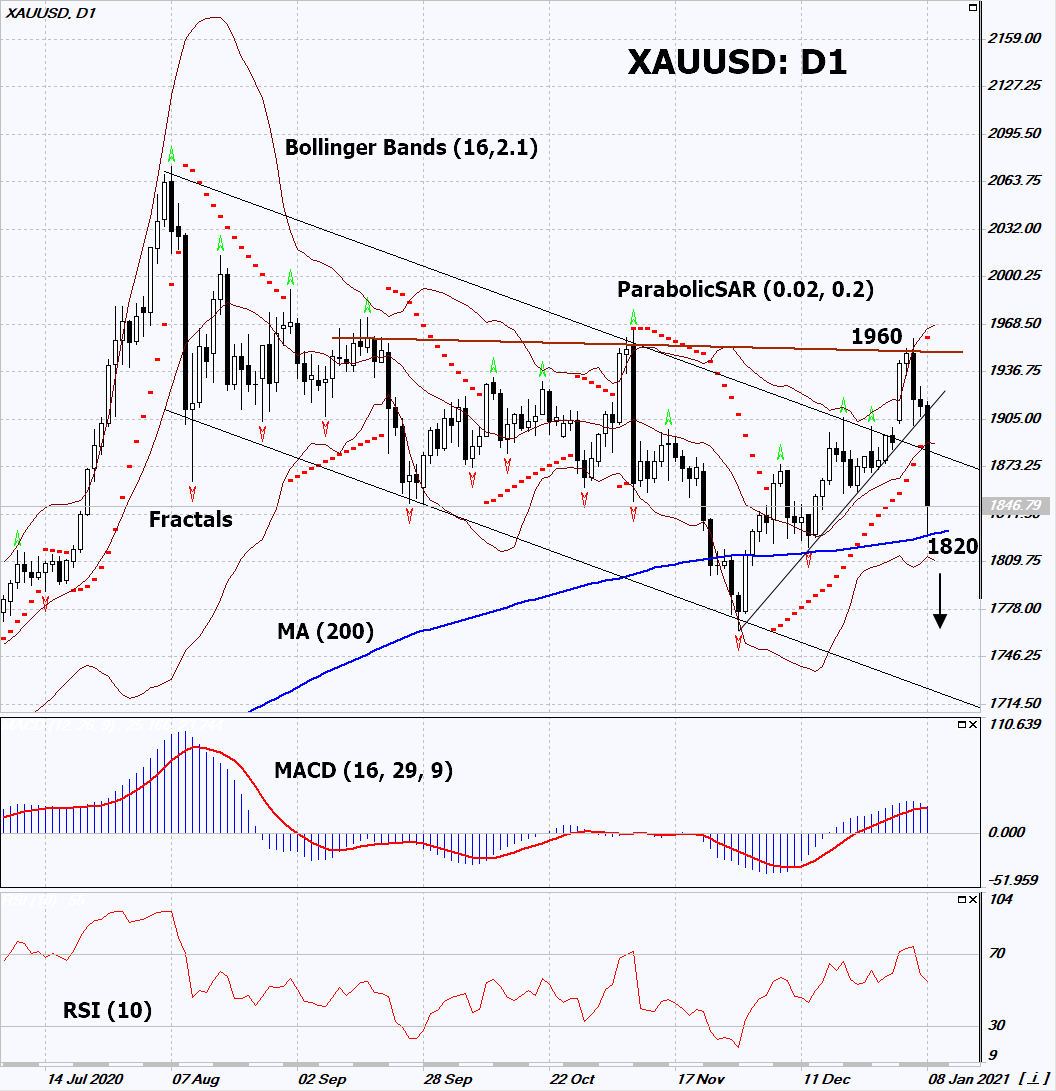
| مؤشر | الإشارة |
| RSI | محايد |
| MACD | محايد |
| MA(200) | محايد |
| Fractals | محايد |
| Parabolic SAR | بيع |
| Bollinger Bands | محايد |
الذهب تحليل الرسم البياني
الذهب التحليل الفني
On the daily timeframe, XAUUSD: D1 broke down the support line of the downtrend and returned to the downtrend channel. A number of technical analysis indicators have generated signals for further decline. We do not exclude a bearish move if XAUUSD falls below the 200-day moving average line and the last low of 1820. This level can be used as an entry point. The initial risk limitation is possible above the last high and the Parabolic signal: 1960. After opening a pending order, move the stop following the Bollinger and Parabolic signals to the next fractal high. Thus, we change the potential profit/loss ratio in our favor. The most cautious traders, after making a deal, can switch to the 4 hour chart and set a stop-loss, moving it in the direction of price movement. If the price overcomes the stop level (1960) without activating the order (1820), it is recommended to delete the order as there are internal changes in the market that were not taken into account.
التحليل الأساسي لـ المعادن الثمينة - الذهب
The strengthening of the US dollar caused a correction in gold prices. Will the decline in XAUUSD quotes continue?
Investors are looking at precious metals as alternatives to dollar assets. Therefore, gold quotes and the US dollar index often move in antiphase. After winning the Senate elections in Georgia, Democrats control the entire US Congress. This greatly facilitates the plans of the new Democrat President Joe Biden to change the tax code and increase taxes on corporations. This can increase US budget revenues and reduce its deficit. It is still difficult to say whether taxes will actually increase and how soon this may happen. However, the dollar index has already increased. The yield on US 10-year government bonds rose to 1,12% per annum from 0,9% in early 2021. This has a negative impact on gold quotes.
:تنبيه
يحمل هذا الموجز طابعاً إعلامياً و تعليمياً و تنشر بالمجان . تأتي معظم البيانات المدرجة في الموجز من المصادر العامة معترفة أكثر و أقل موثوقية . مع ذلك ، لا يوجد تأكيد على أن المعلومات المشارة إليها كاملة و دقيقة . لا يتم تحديث الموجز . معظم المعلومات في كل موجز ، تتضمن الرأي و المؤشرات و الرسوم البيانية و أي شيئ اخر وتقدم فقط لأغراض التعريف وليس المشورة المالية أو توصية . لا يمكن اعتبار النص باكماله أو أي جزء منه و أيضاً الرسوم البيانية كعرض لقيام بصفقة بأي اداة . آي إف سي ماركيتس وموظفيها ليست مسؤولة تحت أي ظرف من الظروف عن أي إجراء يتم اتخاذه من قبل شخص آخر أثناء أو بعد قراءة نظرة عامة .


